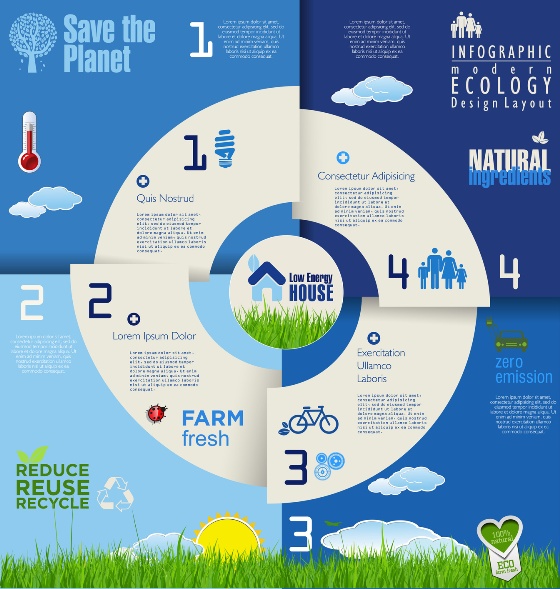
In recent years, it seems that more and more companies are utilising infographics as part of their digital marketing campaigns as well as PR efforts – and it’s obvious why. Infographics are a fabulous, eye-catching tool that allows companies to communicate complex concepts in a simple and effective manner to a wide audience. For those that don’t know what an infographic is, the Technopedia definition sums it up excellently: “An infographic is a visual representation of a data set or instructive material. An infographic takes a large amount of information in text or numerical form and then condenses it into a combination of images and text, allowing viewers to quickly grasp the essential insights the data contains.”
So, if you’re looking to make an impact with your digital marketing campaign, here are several reasons why you should consider creating a snazzy infographic:
Shareability
As any marketer knows, social media is a great tool for getting your online content, such as blog posts, to go viral – this applies to sharing content in the form of infographics to an even greater extent. When posting a link via social media, people will be far more inclined to click on something that they expect will be visually stimulating and entertaining rather than yet another sea-of-text blog post. By having social media buttons integrated on the webpage or blog where your infographic has been posted, it allows anyone who comes across it to share it to their own online network, and their associates may also share it with their network, and so forth! There are also numerous infographic seeding sites that will help share your infographic digitally and ensure you get plenty of backlinks (which will help your company’s search engine rankings).
Aesthetically appealing
Knowing you’re going to get the same level of understanding, would you rather learn about an exciting new topic through a vibrant image or through a black and white block of text? Most people would choose the former! Humans are very visually dominant in the way we learn things. When we combine textual information with visual illustrations, it’s creating a more visceral experience for our audience, ensuring what is learnt is retained to a higher degree.
Easily digestible
Any blog writer will tell you that ensuring an article is easily digestible is one of the key factors in keeping your bounce-rate low. People are quick to ‘value-scan’ a page for information, and if they don’t find anything of use within a couple of seconds, they are likely to click away. This is the reason that many blog posts (such as this one) are written using lists and clear sub-headings, so that people know exactly what to expect as soon as they hit the page! Fortunately, by using an infographic, the problem of digestibility is already taken care of – the page visitor is immediately confronted with everything they want to know in the form of a clear and aesthetically pleasing illustration.
Communicates data more effectively
Sometimes it’s just not pleasant to have to sift through a sea of statistical data before you can make sense of it. With an infographic, you can graphically depict the conclusions drawn from the data alongside the data itself so that anyone who sees it is likely to understand exactly what you mean without having to rack their brains. Remember, time is a valuable commodity, the quicker you can cut to the important stuff, the better!
Improves brand awareness
Why not create a super-cool infographic that not only provides a great deal of information conveyed in an entertaining and visually stimulating manner, but also includes the logo and colour-scheme of your company’s branding? By doing this, you’re able to selflessly share some great information in a way that doesn’t come across as a hard-selling technique, but also position your company as a source of value on the internet. Once people see that you have a high quality infographic, they are also likely to infer positive things about your company as a result.
See this example of an infographic entitled “What is mentoring?” that Fortune PR developed for Sainsbury Management Fellows – you can download a copy of the infographic from this page and get our help to develop yours!
(Photo credit: http://en.fotolia.com/)
Tags: infographics


